Tag Archives: Storyboard

Need to Review a PowerPoint Presentation? Then Build a Storyboard Using This Template!!


For three years here at Microsoft, one of my duties was to oversee all keynotes at our annual Worldwide Partner Conference (WPC).  For example, in 2010, I oversaw 42 different keynotes involving almost a 500 member virtual team that spanned Microsoft and dozens of partner companies. 

The Worldwide Partner Conference is a 15,000-attendee conference for the partner companies who sell Microsoft software or build solutions on Microsoft software.  These partners produce almost 100% of Microsoft’s $60 Billion revenue stream.  The show itself is an amazing event and two years ago in just the first 48 hours; we generated 1.4 MILLION page views on the show website.  Its high pressure, high stakes keynotes and presentations. 

One problem I encountered when I started the job was how do I get everyone on the same sheet of music?  How do I make sure we are telling a consistent story across all of the keynotes?  I found that when I sat down to a review with key stakeholders for one keynote, they wanted to know what the other keynoters were saying so they could coordinate messages.  However, when I would show printouts of others keynotes to them, they often would not understand because paging through a 10 or 20 page printout would hinder their ability to visualize the full presentation.  Therefore, I turned to Hollywood for my answer.  I started making storyboards of each keynote.

A storyboard is an 11×17 printout that shows all of the slides from a single PowerPoint presentation.  Here is an example of one.


Voila, my problem was solved!  It turns out, that when I would hand a storyboard to a reviewer, it would take them about 90 seconds to understand even the most complex of keynotes.  They could jot notes down right on the paper and instead of taking 10 or 15 minutes per keynote, we could do it in less than 5.  That is a huge timesavings and it generated a better outcome.  As a result, for the last three years, whenever I need to review a PowerPoint presentation with others I make a storyboard.  It only takes about 10 minutes.  Here is how to do it. 


Create a storyboard in PowerPoint

  1. Open Presentation:  Open up your ready to review presentation in PowerPoint.
    Note:  These instructions are for Office 2010.  It is a similar procedure in Office 2007 but the steps do differ slightly.
  2. Save Each Slide As A Picture:
    1. Choose File
    2. Save As
    3. Save: Go to the Save as Type pull-down and choose PNG Portable Network Graphics Format.
    4. Click Save
    5. Choose Every Slide:  You will be prompted by the following message “Do you want to export every slide in the presentation or only the current slide?”  Choose the Every Slide option.
    6. PowerPoint Creates Pictures:  PowerPoint will generate the graphics slide to the location you have chosen and then offer a confirmation message like what I have below when it is done. 
    7. Select OK
  3. Make Storyboard File:  Open the Storyboard_Template.pptx (Storyboard_Template) presentation included in this blog post.  This is a pre-formatted 11×17 storyboard template.  Name it and save it.
  4. Insert Storyboard Pictures:
    1. Go to Insert and Select Picture
    2. A File Explorer Window will open.  Navigate to the file folder where the PNG files are stored that you created in Step 2.
    3. Select only the content slides.  You can do this by holding down the CTRL key continuously while clicking each slide you want with left clicks of the mouse and click Insert.
  5. Format Storyboard Pictures:  All of these PNG pictures will now be inserted into your storyboard template.   Do three things while these PNGs are still selected. 
    1. Select Picture Tools – Format
    2. Go to the upper right corner and change their width to 2″. 
    3. Click on Compress Pictures, on Target Output use the highest resolution available (either Print or Document Resolution is usually best.  Then select OK.
  6. Organize The Storyboard Pictures: 
    1. Now all you have left to do is organize them in storyboard format.  Select the first slide (the one in the upper left hand corner and the farthest back and move it to the upper hand most spot.
    2. Move each subsequent slide in line with it.  PowerPoint 2010 has a very cool alignment feature that will help you keep them in line.  Do this for the remaining slides.
    3. The end result is a storyboard


Here is an infographic that shows you these steps visually.  The file is also attached.  How To Build A Storyboard Infographic

Note:  In step 5b, you can size down as far as 1.4″ in width, which allows you to get 80 slides on the 11 x17 or any number that is higher.  It is all about getting 100% of your slides on one page.  P.S.  If you have more than 80 slides, you should be using Garr Reynolds presentation method OR you have too many slides in your deck.

Print Out Your Storyboard

  1. Setup Printer
    1. Choose File and then Print
    2. Click on Printer Properties
    3. Select Other Size for Paper
    4. Select 11×17 for both Input Paper and Output Paper
    5. Click OK
    6. Click OK
  2. Setup Print Job
    1. Select Full Page Slides Pull Down
    2. Select Scale To Fit Paper
    3. Select High Quality
  3.   Hit The Print Button 

Here is an infographic that shows you these steps visually.  The file is also attached.  How To Print A Storyboard Infographic


The simple act of creating a storyboard has improved the quality and speed of my reviews significantly.  The first few times you have to make a storyboard it will take 15 minutes or so, but after doing it a few times you will cut that down to less than 5.

Thanks for tuning in.

 DK

mailto:dkarle@microsoft.com


Get Some Meat In Your Presentation – Adding Content!


I had an executive I worked with for some time who used to tell me to never to do a content-free presentation.  This confused me, what could content-free mean?  After a little back and forth with the exec I finally figured out what she meant.  She meant to make sure to include real world, concrete proof that supported whatever points I was making in the presentation.

An example might be if I’m giving a sales pitch and I demonstrate the latest Features of the product.  Or maybe when I’m running a project team meeting and I use Data to back up my key points.

Regardless, whenever I make a point in a presentation, I always make sure I have content available to back it up.  In my experience, content falls into one of the following categories:

  1. Case Studies And Real-World Examples: “Let me tell you a story about how this exact thing happened to John.  You see…”
  2. Demonstrations:  “Here, let me show you how this product eliminates that problem by…”
  3. Data:  “As you can see here, a possible cause for sales being down is that we cut the sales travel budget by X%.”
  4. Picture Or Graphics:  “Here is an overview of the entire project workflow.  As you can see here, the reason Group A and Group B are not working well together is because of…”
  5. Video:  “Here let me show you a little video of a customer telling us what they like and don’t like about our product.”
  6. Handouts:  “Please open the document in front of you and on page X you will see…”
  7. Props:  “Let’s hand this around so everyone can get a chance to see how this works.”


A good way to think about it is if you are going to make any kind of factual statement, make sure you can back it up with content.   At every step of the Modern Presentation Method you are sourcing, evaluating, and refining content. 

  1. When you are Visualizing your presentation, you should be out gathering raw content and analyzing it to see how you can use it in your presentation. 
  2. When you Storyboard, the content you have gathered often constrains what story you can tell.  For example, if the data only supports one outcome then that is the outcome you must present.  If the product does some things poorly, then that affects the story.  It goes on and on as you refine the content and incorporate it into your presentation.
  3. When you Build & Refine, this researched and refined content then becomes the proof for whatever point you are trying to make. 


The cardinal rule is, if you are going to claim something to be true or factual, make sure you can prove it with concrete, bulletproof content.  You can bank on this best practice.

Thanks for tuning in.

 DK

mailto:dkarle@microsoft.com


MPM Step #2: Storyboarding – Fast, Easy, and Useful


The second major step in the Modern Presentation Method (MPM) is Storyboarding.  In this step, we are going to take our work from Visualization and craft a great story.  Storyboarding is a very quick process and should not take you much time at all.  The purpose of storyboarding is to lay out a complete end to end picture of what the presentation flow and story is.  In many ways it is simply a visual outline.

In today’s example I’m going to be doing an Organizing Presentation.  In this case, it’s the dreaded staff meeting.  Normally, I would only have to storyboard a staff meeting a couple of times a year because as soon as we find a model that works for the team, it would become the standard for all future staff meetings.  I would only storyboard if we change the format. 

Best Practice:  Whenever I take over a new team, one of the first things I do is take a few hours and look at how the team communicates.  I then design a very simple communication rhythm that ties into whatever decision making cycle we are using.  An important part of this is coming up with a model for how we do each of the four organizing presentations (Observe/Inform/Status, Orient, Decision, and Act/Mission)

One important note about staff meetings.  They are booooring.  So incredibly, mind-numbingly, boring that oftentimes nothing useful gets accomplished.  I have a few things that I do to combat this.

  1. The most successful staff meetings are ones where you cover everything AND where you also end early!  If I have 60 minutes scheduled, it is a nice gesture for the team if you can finish in half that time. 
  2. Break up the monotony by changing pace every 10 minutes or so.  Start with one activity like PowerPoint slides but then after 10 minutes switch to discussion.  And so on.  Don’t present for 60 minutes straight!
  3. Make sure discussion is included in every staff meeting.  An engaged audience is critical to success.
  4. No one is allowed to use laptops or smart phones during a presentation.  Everyone needs to be all in.


Let’s get started.

Lay Out the Basic Story In Text

The very first step is to take my story framework and lay it out into something more concrete.  Here is what my whiteboard looks like at the end of my Visualization process.

You can see my Visualization checklist is filled out, I have identified my audience and I have a basic story framework.  I have also selected my medium for this meeting and it will be a combination of Excel, Word, and PowerPoint.

My first step in Storyboarding is to take this framework and lay it out textually.  I usually take some 3 x 5 cards and replace each of the door points and sub bullets with a very well thought out couple of sentences.

In the framework, my top door point is Project Status Update.

On the back of the 3×5 card(the lined side), I will write several sentences summarizing what I am trying to accomplish with this door point.    

Here is what the back of the card looks like for this first door point.

I then do this for each of the door points and sub-points until I have replaced all of my stickies and handwritten notes.  The end result is a bunch of 3 x 5 cards with each point threshed out.


Does it Make Sense

Now it’s time to ask if the flow of the meeting makes sense.  In the case of this status meeting I am ok with the order of the door points but I realize that my last sub point (Overall Status) for Door Point 1 (Project Status) should actually be the first, not the last sub-point so I move it.

Add Key Visuals

Now I turn the cards over and do a stick figure drawing of what the graphics should look like for each slide, what should be on each Word Doc, and what each table should look like in Excel. 

In my first Door Point (Project Status), I am going to have the team read a short 4 page Word doc handout that summarizes the overall status of the team.  I also am creating PowerPoint slides to keep the meeting on track.

The first slide will be this one, which I will put up when I give out the handouts.

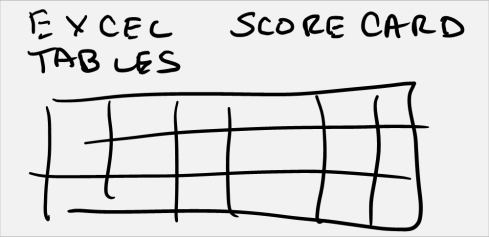
Then I do separate graphics for the proposed Word Doc and supporting Excel tables that they will be reading.

And then slides to help frame the ensuing status discussion for when they get done with the handout.

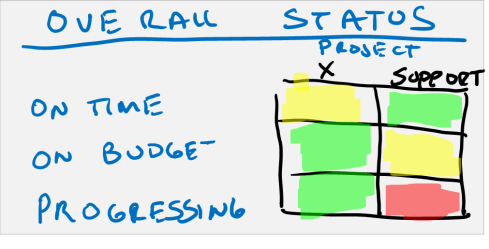
Here is overall status slide.

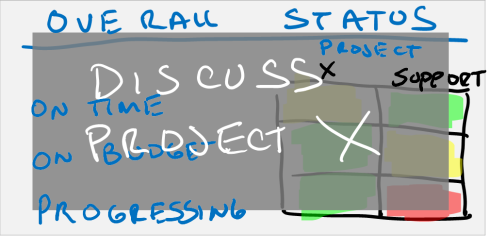
Then the slide I will have up while we discuss Project X.

Then the slide I will have up when we discuss the support project.  Now you will notice that I am not putting a ton of detail into the slides.  They will have the detailed in front of them in the Word doc and the slides are simply here to frame the discussion.  There is the added advantage that the audience members have a hard copy to write their thoughts on. 

When I am done with all the graphics each 3 x 5 card now has a textual description of what I am trying to accomplish along with any supporting graphics, documentation, and data tables roughly outlined.

My storyboard now looks like this.


Pay Attention To Transitions & Time

Take a step back and look at the overall flow and also the graphics.  Look at it through the eyes of the audience and ask yourself the two most important questions for any presentations.  First, does the presentation accomplish what you want?  In this case I would say yes.  The purpose of this presentation is to get a clear team status.  In this case, I have done that on both the project side of the house and the team side of the house.  Check!  Also, my overall flow goers from highest priority to least priority so I know if we fall behind, we will at least get through the critical content.

The second question is whether or not you are meeting the audience needs/wants.

  1. Was this an efficient use of time?  I think so.  One tip is to assign x minutes to each door point and then take a look at how long the overall presentation is.  Remember, the goal is to completely cover each topic AND end early if possible.
  2. Was there ample room for discussion?  Yes.  In the first and third door point section there is discussion scheduled.


Before I move off of this, I might consider adding an agenda handout or slide so that I can set everyone’s expectation on what subjects we will cover and how long we will spend on each. 

 Add the Hook, Stories, Demos, and Props

Now one thing that I try to do with every presentation, even a staff meeting, is add some excitement and sizzle.  Now that I have a coherent story to tell, we can add the elements that will help galvanize and keep an audience’s attention.  I usually think in terms of the Hook, what supporting Stories I can tell, whether or not an actual Demo may help, and what Props might help.

The Hook is a rhetorical or visual device that you can add right out of the gate that is surprising to the audience.  One tried and true one that I use whenever I run a first staff meeting with a new team is to announce that I want to get the meeting done early every time.  This usually makes everyone sit up a little straighter as they want to get out of the room as fast as possible and they don’t often hear the meeting leader say that they want the same thing. 

Another example of a hook might be a surprising fact or statistic.  It might be good.  “Do you know that Project X is 25% ahead of schedule right now?”  Or it might be bad.  “Project X is blocked by A and I think we can get this back on track right here”.  Regardless, saying something to get the audience’s attention and make them a participant right out of the gate is the purpose of the hook.

Stories, demos, and props can be sprinkled throughout to bring things to life.

  • Stories – Talk about real life examples.  In staff meetings I like to bring the voice of the real world into the discussion.  Let me tell you the story about how this issue that is holding up part of Project X is slowing everyone down until we can get it fixed.  “Joe Smith from engineering was….” 
  • Demos – When I used to work in R&D I would often show off a problem in a staff meeting.  “Here let me show how this one bug actually shows up in this feature”.  This would then be followed by an actual demonstration.  The opposite is also true for something that works right.  “Let me show you how cool this thing is”. 
  • Props – There is nothing wrong with show and tell.  Bring in the latest version of the product and let people play with it. 


All of these are great ways to keep the audience engaged and present as you work through any type of presentations.  You’ll hear a lot more in this in future posts.

Summary

So that’s storyboarding.  From start to finish today, it took me less than an hour to do this storyboard.  Now clearly I’m no artist, but I still do this step because it gives me a great sense of overall flow and the visual impact at every step of that flow.  Human’s dominant sense is vision and I storyboard to play directly to the dominant sense.   Storyboarding also lets me look at my entire story structure at a glance.  This is a huge advantage over a text outline!

One last note.  At this point in the process I still haven’t opened up any software.  In fact, everything I’ve done so far was done with a whiteboard, sticky notes, 3 x 5 cards, and some writing tools.

As always, I welcome your emails and comments.  Thanks for tuning in.

DK

mailto:dkarle@microsoft.com